Course Lessons
chapter 5 : Data Shape
2. Kurtosis
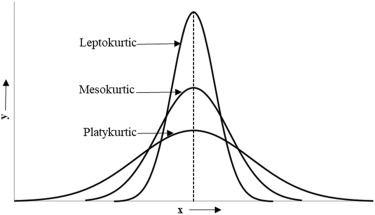
Kurtosis measures the "tailedness"
of the distribution — that is, how much data are in the tails (extreme
ends) compared to the center. It shows how peaked or flat a distribution is
relative to a normal (bell-shaped) curve.
- High
kurtosis (Leptokurtic): Tall peak and heavy tails → more
extreme values (outliers).
- Medium
kurtosis (Mesokurtic): Like a normal distribution.
- Low
kurtosis (Platykurtic): Flat top and light tails → fewer
outliers.
Simple Example:
Imagine two datasets:
- A
group of students mostly scoring around 50–60 (values close to average) —
this might show low kurtosis if few extreme scores exist.
- Another
class where most scores are around the mean but some students have very
high or very low scores — this shows high kurtosis because tails
are heavier.
What it tells you:
Kurtosis helps understand whether a dataset has many outliers or data
tightly clustered around the mean.