Course Lessons
chapter 6 : Correlation
Pearson Correlation (r)
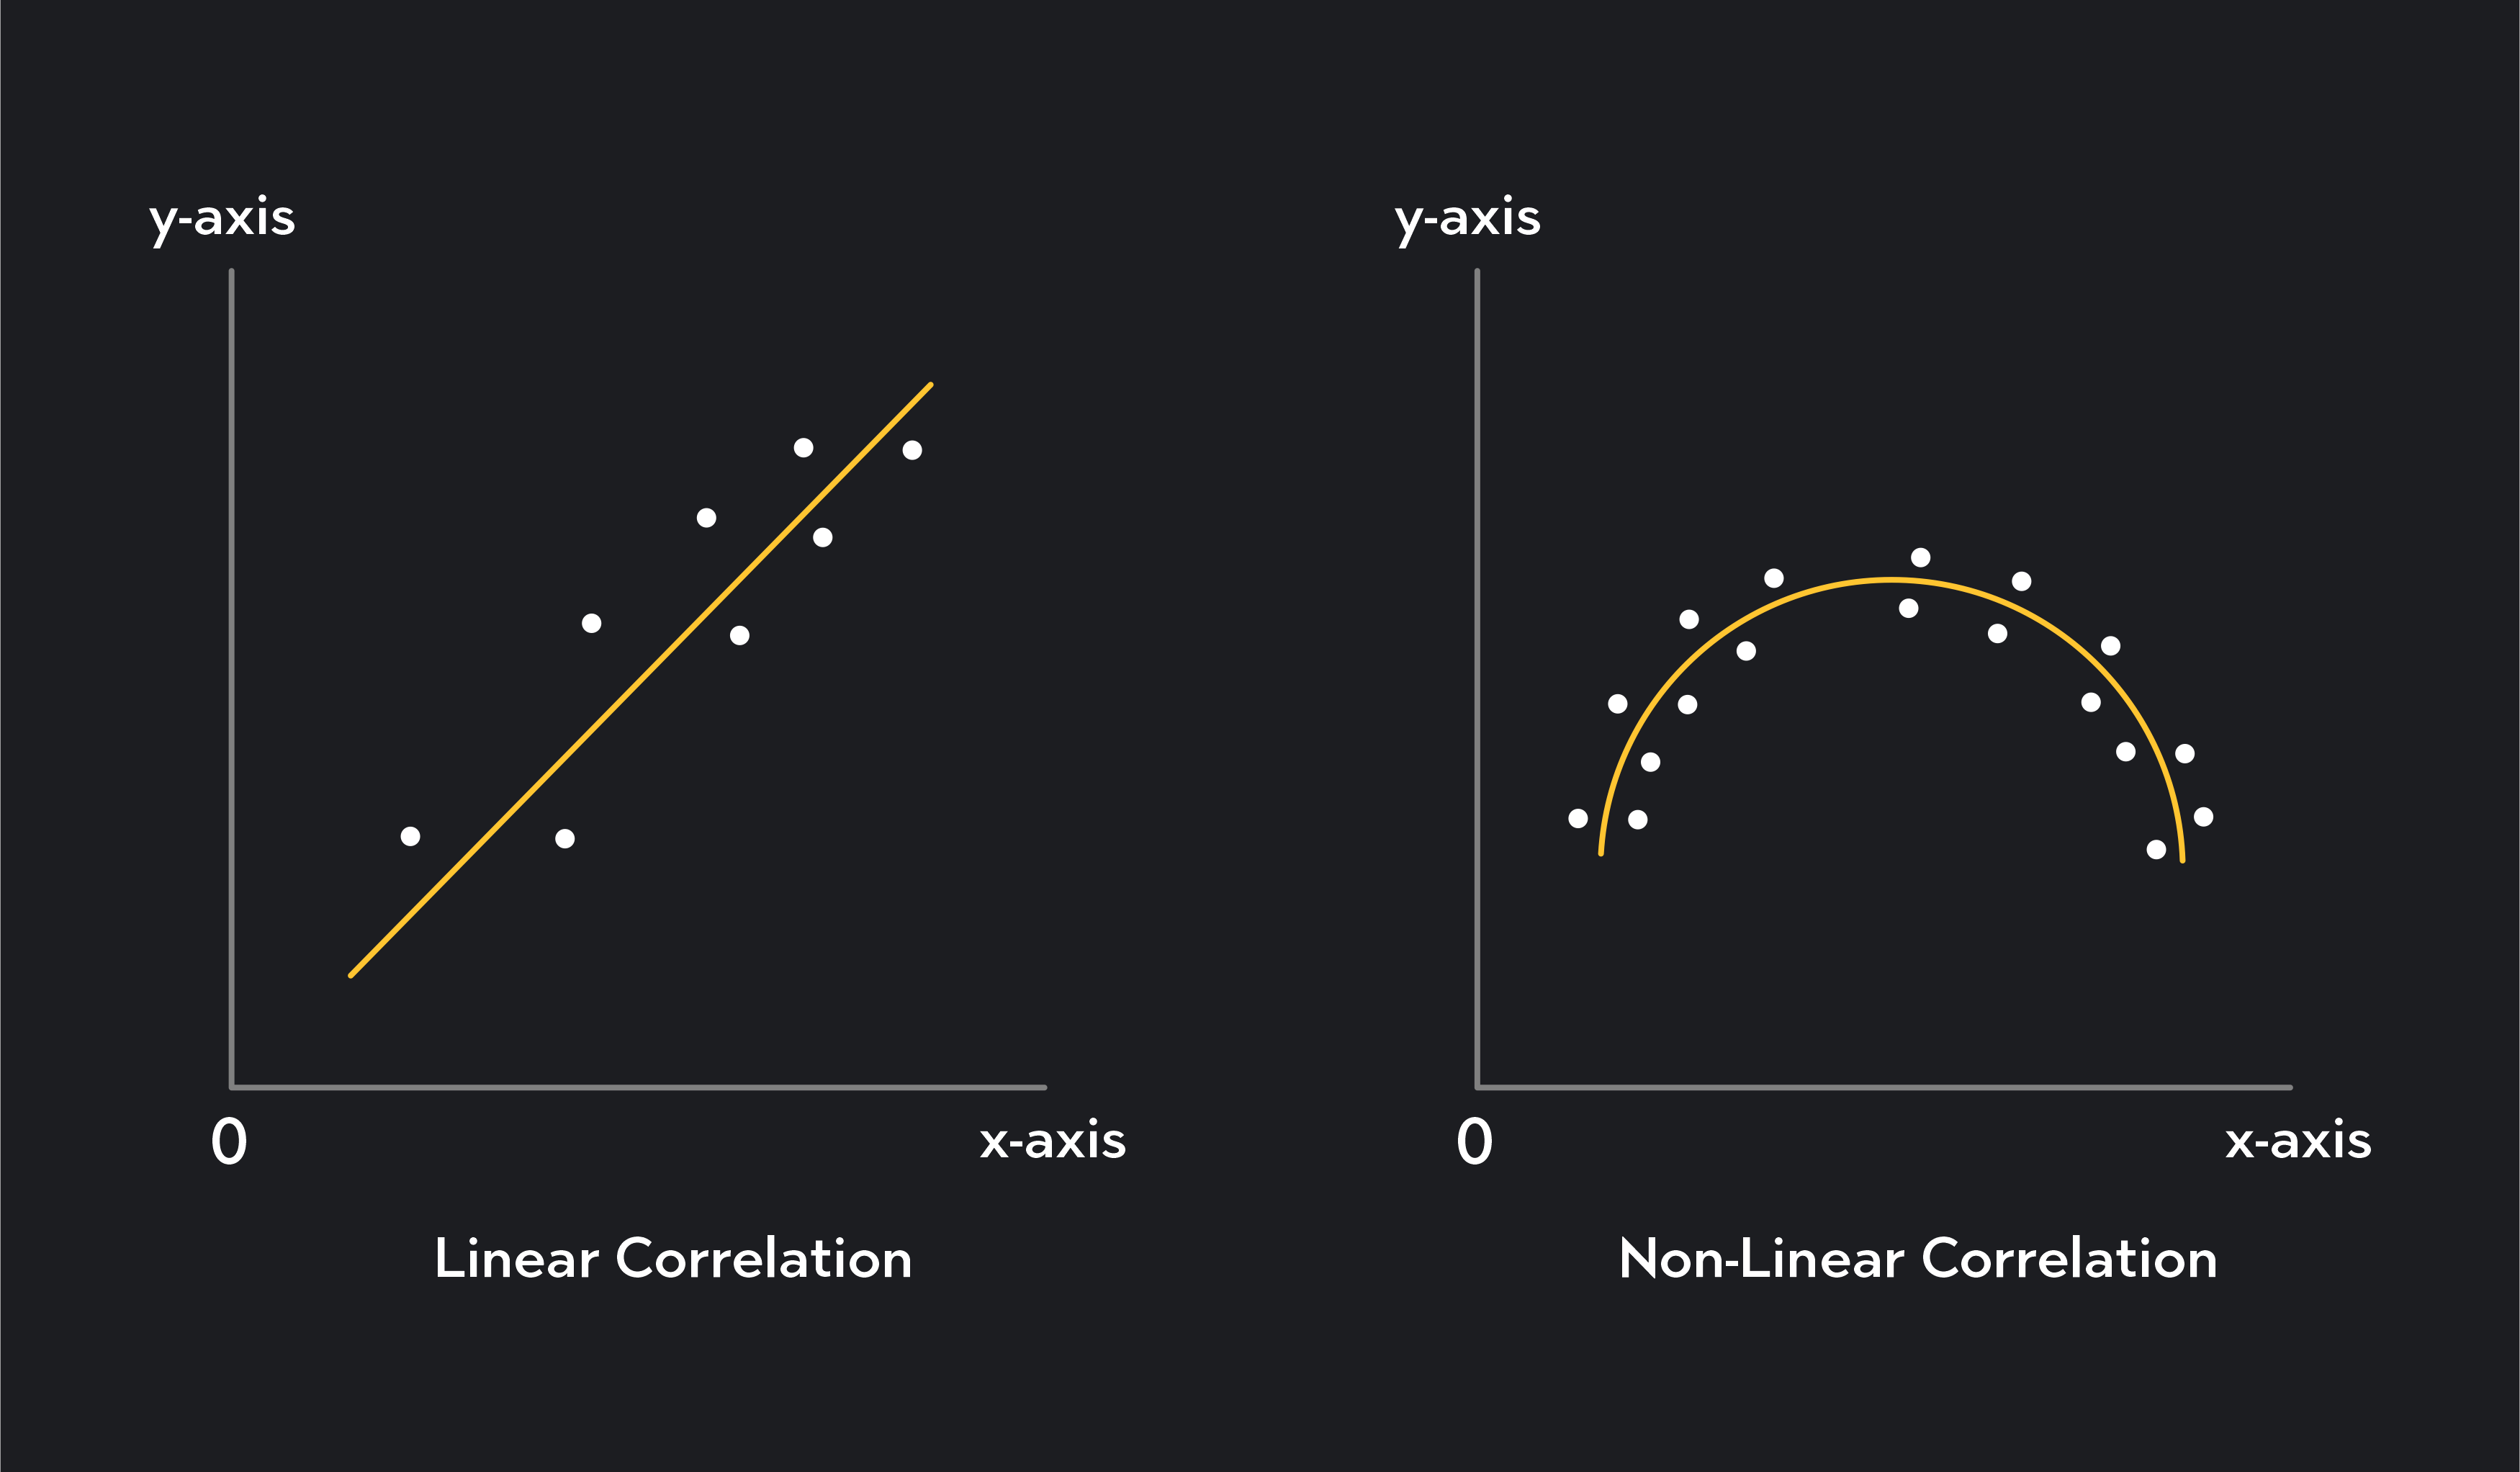
Measures linear relationships — relationships that can be shown with a straight line.
Works best when both variables are continuous, normally distributed, and have no extreme outliers.
Result is a value between –1 to +1:
-
+1 → strong positive linear relationship
-
–1 → strong negative linear relationship
-
0 → no linear relationship
Example: Height and weight often show a positive Pearson correlation.